


Next: Chain Graphs Up: Introduction Previous: KMC and DPS Averages Contents
Mean Escape Times
Since the mean first passage time between states  and
and  , or the escape time from a subgraph, is of particular interest, we first illustrate a means to derive formulae for these quantities in terms of pathway probabilities.
The average time taken to traverse a path 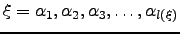 is calculated as
 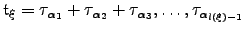 , where
  is the mean waiting time for escape from node
  , as above,
  identifies the
  th node along path
  , and
, and  is the length of path .The mean escape time from a graph
  if started from node
  is then
 | (6.20) |
If we multiply every branching probability,  , that appears in
  by
by  then the mean escape time can be obtained as:
 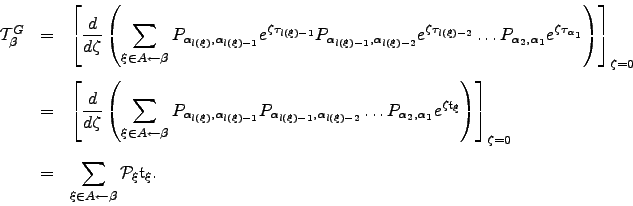 | (6.21) |
This approach is useful if we have analytic results for the total probability  , which may then be manipulated into formulae for
  , and is standard practice in probability theory literature [208,209]. The quantity
  is similar to the `
 probability' described in Reference GoldhirschG86. Analogous techniques are usually employed to obtain and higher moments of the first-passage time distribution from analytic expressions for the first-passage probability generating function (see, for example, References Raykin92,MurthyK89). We now define
 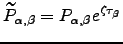 and the related quantities
 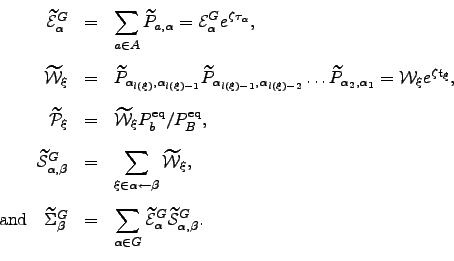 | (6.22) |
Note that ![$ \left[\mEt _{\alpha}^{G}\right]_{\zeta=0} = \mE _{\alpha}^{G}$](img713.png) etc., while the mean escape time can now be written as
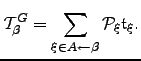
etc., while the mean escape time can now be written as ![$\displaystyle \mathcal{T}^{G}_\beta = \left[ \frac{d\tilde{\Sigma}_\beta^{G}}{d\zeta} \right]_{\zeta=0}.$](img714.png) | (6.23) |
In the remaining sections we show how to calculate the pathway probabilities,  , exactly, along with pathway averages, such as the waiting time. Chain graphs are treated in Section 4.2 and the results are generalised to arbitrary graphs in Section 4.3.
Next: Chain Graphs Up: Introduction Previous: KMC and DPS Averages Contents Semen A Trygubenko 2006-04-10